
3 scores max per player; No foul language, show respect for other players, etc.
Name | Score | Date | ||
|---|---|---|---|---|
| 1 | ||||
| 2 | ||||
| 3 | ||||
| 4 | ||||
| 5 | ||||
| 6 | ||||
| 7 | ||||
| 8 | ||||
| 9 | ||||
| 10 |
This is a timed game. Your final score is equal to the total score minus time taken.
Game: CHOOSE OR LOSE
Aim: Choose the right answer; beat the clock
Method:
You start the game with 50 points. Each question has 2 to 4 answers. Select the correct answer before your time runs out to score points. Right answers are +10, wrong answers are -2, out of time is -5.
This is a timed game. Your final score is equal to the total score minus time taken.

anonymous
"Calculate the mean"
CHOOSE OR LOSE game to practice
'Grouped frequency table: modal group, range' for 7th grade
7th grade / Statistics / Continuous data / Continuous grouped data / Grouped frequency table: modal group, range
Grouped frequency tables: modal group, largest range
Continuous data can be represented in a "Grouped frequency table" where each class (group) covers the data points within a certain range, and the classes together cover the entire range of the data.
The benefit of grouped frequency tables becomes clear when there are so many raw data points that discrete values would become difficult to process. A limitation of continuous data is that individual data points are lost so that exact calculations of the mode or range of the original discrete data points becomes impossible. Instead techniques have been developed to approximate these values for continuous data.
Instead of a mode (the most frequent individual value in a data set), we can find the "modal group" which is the class of data that has the highest frequency. So if we have a grouped frequency table with classes 1-20, 21-40 and 41-60 that have frequencies of 12, 7 and 5 respectively, then the modal group is 1-20 because it has the highest frequency of 12.
Instead of an absolute value for the range of a data set, we can find the "largest range". This is the difference between the largest possible value in the biggest class and the smallest value in the smallest class. So if our grouped frequency table has classes 21-40, 41-60 and 61-80, then the largest range is 80 minus 21 which is 59.
In this topic you are asked to find either the modal group or the largest range for a series of grouped frequency tables. There are 8 question/answer pairs in the lessons, and an additional 8 question/answer pairs in all the games and tests.
With our Choose or lose math game you will be practicing the topic "Grouped frequency table: modal group, range" from 7th grade / Statistics / Continuous data / Continuous data. The math in this game consists of 16 questions that ask you to identify the modal group or largest range for each grouped frequency table.
Our CHOOSE OR LOSE game is a simple activity to help secondary math learners and will improve the speed at which you can solve problems in the given topic. It does not rely on the learner typing in the answer. Rather, the learner must choose the correct answer from a list of 2, 3 or 4 similar answers.
CHOOSE OR LOSE encourages faster problem-solving for common and vital secondary math topics. CHOOSE OR LOSE is a timed game with a leaderboard for each topic at each of the 4 levels on offer. You can play the game with or without audio and robots.
UXO * Duck shoot * The frog flies * Pong * Cat and mouse * The beetle and the bee
Rock fall * Four in a row * Sow grow * Choose or lose * Mix and match
Latest leaderboard entries: Choose or lose


How to play Choose or lose to practice
'Grouped frequency table: modal group, range' for 7th grade

Our CHOOSE OR LOSE game asks the learner to click on the correct answer from a selection of possible answers before the clock runs down.
- Click on PLAY to start.
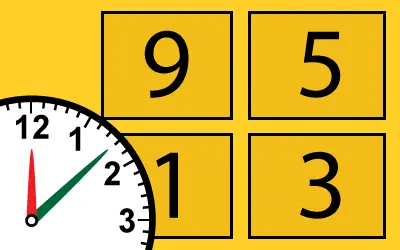
- You are presented with a topic question, then a list or grid of 2 to 4 possible answers (depending on the topic you have chosen).
- You must select the correct answer by clicking on it before the clock counts down.
- You have 10 seconds in total to answer each question.
- The clock starts ticking down 5 seconds after the answers have appeared.
- To hear the question again, click / tap on the question box.
- The browser will speak the potential answers on rolling-over them.
- A correct answer gains you 10 points.
- A wrong answer loses you 2 points.
- A time-out loses you 5 points.
- A score is kept of correct answers against number of answers.
- The game is timed, and your final score (points earned minus time taken) is given at the end of the game. Top 10 scores for a topic get you a place on the leaderboard.


